Introduction: Why Monitoring Matters
Imagine you’ve deployed an application, everything’s running smoothly until, without warning, it crashes. How do you identify the root cause, pinpoint when the performance started to degrade, or gather the insights needed to prevent a repeat?
This is the core of modern observability. In the high-stakes environment of 2026, where microservices, serverless architectures, and AI-driven workloads are the norm, monitoring is no longer just a safety net; it is a strategic asset. Tools like Prometheus and Grafana have evolved into the backbone of system reliability, allowing engineers to transition from reactive firefighting to proactive, intelligent system management.
As we move through 2026, the industry has shifted toward Unified Observability. It’s no longer enough to just "see" that a server is up. Teams now require deep context linking metrics, logs, and traces into a single story. With the widespread adoption of OpenTelemetry (OTel) as the universal standard, the integration between data collection and visual analysis has become seamless. Furthermore, the rise of AI-powered observability means that these tools don't just show you data; they help you predict failures before they happen and optimize cloud costs in real-time.
Whether you are managing a global fleet of Kubernetes clusters or a small set of specialized AI models, understanding how to leverage the specialized strengths of these two powerhouses is essential for maintaining a competitive edge in a zero-downtime world.
What is Prometheus?
Prometheus is a powerhouse open-source monitoring and alerting toolkit designed specifically for reliability in cloud-native environments. As of 2026, it has evolved into Prometheus 3.0, bringing significant leaps in how we handle complex telemetry and large-scale infrastructure.
In Simple Words:
Think of Prometheus as a high-tech flight data recorder for your digital infrastructure. It doesn’t just watch; it records every vital sign of your servers and applications in real-time. If a "vital sign" such as memory usage, disk space, or request error rates hits a dangerous level, it triggers an alarm immediately, allowing your team to intervene before a minor glitch becomes a total system failure.
Prometheus Core Functions:
- High-Resolution Data: With the introduction of Native Histograms, Prometheus now captures distributions (like latency) with much higher accuracy and lower storage overhead, allowing you to see the "long tail" of slow requests that standard averages might hide.
- Modern Data Standards: It features full, native support for OpenTelemetry (OTel), allowing you to ingest OTLP data directly without complex translation layers, making it a universal receiver for modern telemetry.
- Storage Efficiency: It utilizes a specialized Time-Series Database (TSDB) optimized for massive scale. In 2026, enhanced "Out-of-Order" data ingestion allows Prometheus to handle data from asynchronous sources and IoT devices without losing precision.
- Dynamic Service Discovery: It automatically finds new "targets" such as a new container spinning up in a Kubernetes cluster, so you never have to manually update your configuration every time your infrastructure scales.
- Pull-Based Architecture: Unlike many tools that wait for apps to send data, Prometheus proactively "scrapes" metrics, ensuring that if a service goes silent, Prometheus knows immediately that it's down.
Key Components:
- Prometheus Server: The central engine that handles service discovery, scrapes data from targets, and stores it permanently.
- Exporters: Small, lightweight agents (like Node Exporter or Blackbox Exporter) that translate hardware stats or third-party service data into a format Prometheus can read.
- Alertmanager: A sophisticated notification engine that handles alert silences, inhibition, and routing to platforms like Slack, PagerDuty, or Microsoft Teams.
- PromQL (Prometheus Query Language): The industry-standard language that allows you to perform complex mathematical operations on your data, such as calculating the 99th percentile of response times across thousands of servers.
- Pushgateway: A specialized component used to handle "short-lived" jobs that don't stay alive long enough to be scraped regularly.
What is Grafana?
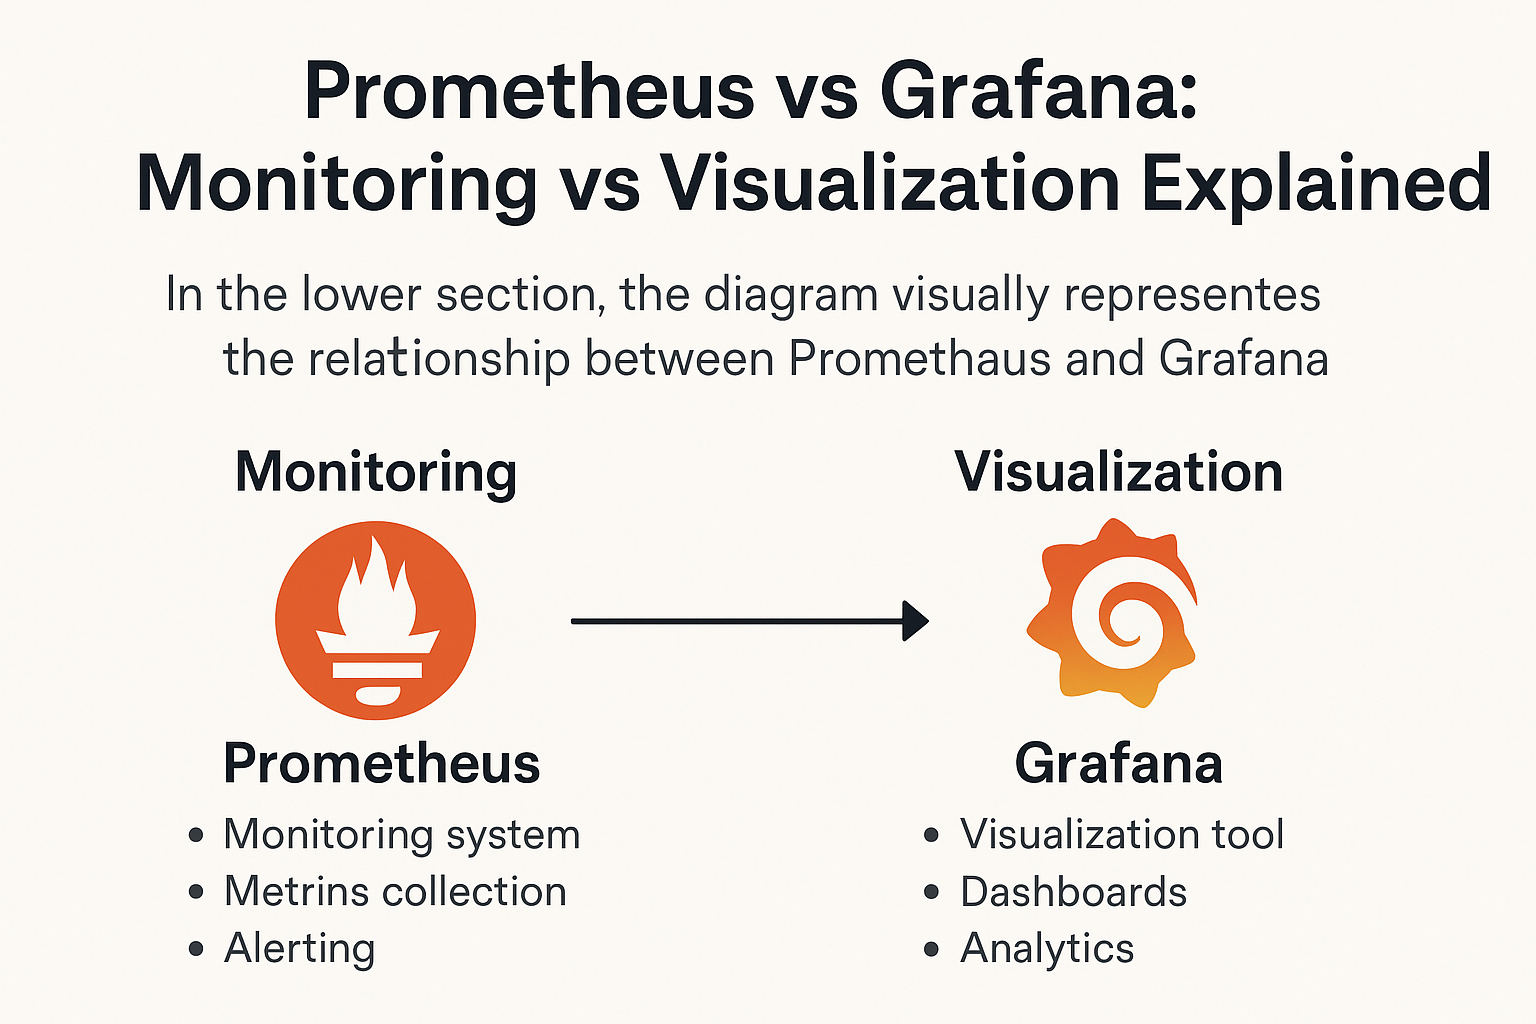
Grafana is the world’s leading open-source platform for visualization and analytics. While Prometheus acts as the "brain" that gathers and stores technical data, Grafana serves as the "eyes" that transforms that raw information into actionable insights.
In Simple Words:
Grafana is your mission control center. It takes the raw, messy numbers hidden in your databases and turns them into stunning, interactive dashboards that anyone from a junior developer to a CTO can understand at a glance. It allows you to visualize your entire stack in one place, whether you're monitoring a single server or a global network of microservices.
Grafana’s 2026 Capabilities:
- AI-Powered Insights: The Grafana Assistant (a context-aware LLM agent) is now a core part of the experience. It helps you build complex dashboards using natural language prompts, debugs your PromQL queries, and can even launch an AI Investigation to suggest root causes for sudden performance spikes or anomalies.
- The "Big Tent" Philosophy: Grafana’s strength lies in its versatility. It doesn't just display Prometheus data; it connects to over 150 data sources. In 2026, this includes deep integrations with Snowflake, BigQuery, MongoDB, and even non-technical sources like Jira, ServiceNow, and Zendesk.
- Unified Alerting: You no longer need to jump between tools. Grafana’s unified alerting system lets you manage, silence, and route alerts from Prometheus, Loki, and SQL databases through a single, visual interface.
- Interactive Scenes: Dashboards have evolved into Grafana Scenes. These are no longer just static charts; they are dynamic, app-like experiences that allow users to drill down from a high-level overview directly into specific logs or traces with a single click, all without losing context.
- Frontend & Real User Monitoring (RUM): Beyond backend metrics, Grafana now provides native tools to track exactly how users are experiencing your app, capturing page load times, JavaScript errors, and user journeys in real-time.
- Continuous Profiling: With the integration of Grafana Pyroscope, you can now visualize the "CPU and memory hot spots" in your actual code, allowing you to optimize performance at the function level directly from your dashboard.
Hire DevOps Engineers Today!

Prometheus vs Grafana: Clear Comparison
While a table is helpful for a quick glance, the true distinction between these two tools lies in their architectural philosophy. In 2026, the line between "monitoring" and "visualization" has blurred, but their core identities remain distinct.
The Role of Data Ownership
The most fundamental difference is that Prometheus is a data owner, while Grafana is a data consumer.
- Prometheus comes with its own high-performance Time-Series Database (TSDB). It is responsible for the "heavy lifting," physically reaching out to your servers, pulling metrics, and writing them to disk. Without Prometheus (or a similar backend), you have no historical data to look at.
- Grafana is stateless regarding your metrics. It doesn't "keep" the data; it simply asks Prometheus for it whenever you open a dashboard. This makes Grafana incredibly flexible because it can ask ten different databases for data at the same time and show it all on one screen.
Scope of Visibility
In the modern observability landscape, Prometheus is deep, but Grafana is wide.
- Prometheus is laser-focused on metrics. It is the gold standard for numerical data over time (e.g., "What was the CPU at 2:00 PM?"). While it excels here, it generally doesn't handle logs or traces.
- Grafana has evolved into a "Single Pane of Glass." It can pull in metrics from Prometheus, logs from Loki, and traces from Tempo. In 2026, it even pulls in business data from SQL databases or project management stats from Jira, allowing you to see how a code deployment affected both server latency and customer support tickets simultaneously.
Intelligence and Automation
The way these tools handle "intelligence" has diverged significantly in recent updates:
- Prometheus focuses on mathematical precision. Its alerting (via Alertmanager) is based on hard logic and PromQL queries. It is designed to be the "silent guardian" that works even if the visual UI is down.
- Grafana focuses on assisted discovery. With the 2026 integration of AI agents, Grafana is where you go to "chat" with your data. While Prometheus tells you that a threshold was crossed, Grafana’s AI features help you understand why by correlating patterns across different data sources that Prometheus cannot see.
User Experience and Interaction
- Prometheus provides a functional "Expression Browser." It’s built for engineers who want to run a quick query to debug a specific issue. It isn't meant to be "pretty" or shared with non-technical stakeholders.
- Grafana is built for collaboration. It features drag-and-drop widgets, fine-grained access control for different teams, and public sharing options. It is designed to be displayed on large "Wallboards" in Operations Centers to give an instant heart-rate monitor of the entire company.
Prometheus vs Grafana: How Do They Work Together?
They are not competitors; they are a perfect synergy. In fact, they are so intertwined that most engineers refer to them as the "Prom-Graf" stack. In the landscape of 2026, this partnership has become the industry standard for maintaining uptime in complex, high-traffic environments.
The Integrated Workflow: From Raw Data to Insight
The relationship between these two tools is a continuous loop of collection, storage, and representation:
- The Extraction Phase: Prometheus acts as the active collector. It goes out into your cluster, whether it's on-premise, in the cloud, or at the edge, and "scrapes" CPU, memory, and application-specific metrics. It records these as time-stamped data points in its high-speed database.
- The Connection Bridge: You integrate the two by adding Prometheus as a "Data Source" inside the Grafana settings. In 2026, this is often handled automatically through service mesh discovery or Kubernetes operators, requiring zero manual configuration.
- The Query Translation: When you view a dashboard, Grafana sends a PromQL (Prometheus Query Language) request to Prometheus. It asks questions like, "What was the 99th percentile latency for the checkout service over the last hour?"
- The Visual Realization: Prometheus returns the raw numbers, and Grafana instantly transforms that mathematical response into a stunning heatmap, gauge, or time-series graph.
Real-World Example: The 2026 E-commerce Scenario
Imagine you are running a major flash sale. Here is how the duo handles the pressure:
- Prometheus is in the trenches, recording a massive spike in "HTTP Requests" and noticing that your "Database Connection Pool" is reaching 95% capacity. It immediately marks this data and prepares an alert via Alertmanager.
- Grafana pulls this real-time telemetry and flashes a glowing red border around your "System Health" widget on the 50-inch NOC (Network Operations Center) monitor.
- The AI Layer: Because of the Grafana Assistant, a smart annotation appears on the graph. It might say: "Traffic is up 400%, but your auto-scaling groups have successfully added 10 new nodes. Current database latency is holding steady at 50ms. This is a healthy, managed surge."
Beyond Simple Graphs: The 2026 "Trace-to-Metric" Leap
In the current year, the integration goes even deeper. If Prometheus detects an error spike, you can click directly on that spike in your Grafana chart. Grafana will then use the metadata provided by Prometheus to automatically pull the exact OpenTelemetry logs and traces related to that specific error. This "context-switching" allows engineers to find the exact line of failing code in seconds, rather than digging through logs for hours.
Hire DevOps Engineers Today!
The Future of Prometheus vs Grafana: AIOps and Beyond
As we look toward the latter half of 2026, the partnership is evolving from simple monitoring into Autonomous Operations (AIOps). The "Prom-Graf" stack is no longer just showing you what happened; it is beginning to predict what will happen through Agentic AI and predictive analytics.
Predictive Scaling and Cost Optimization
Modern Prometheus exporters now collect "Carbon Footprint" and "Cloud Billing" metrics alongside standard CPU data. Grafana uses this to create Sustainability Dashboards, showing you how to scale down underutilized services to save both money and energy without impacting the user experience. In 2026, this is driven by Predictive Capacity Planning, where Prometheus uses machine learning to forecast resource exhaustion days before it occurs, allowing for "just-in-time" infrastructure procurement.
Self-Healing Infrastructure
In 2026, many organizations use Grafana alerts to trigger automated remediation scripts. For example, if Prometheus detects a memory leak in a specific pod, Grafana can trigger a Kubernetes job to gracefully restart that pod while simultaneously opening a Jira ticket for the developers, attaching the exact logs captured at the time of the failure. This moves the Mean Time to Recovery (MTTR) from minutes to milliseconds, as AI agents handle the triage while humans focus on the permanent fix.
AI-Driven Root Cause Analysis
The gap between "knowing there is a problem" and "knowing why" has vanished. With the 2026 Grafana Assistant Investigations, specialized SRE agents ingest Prometheus metrics, Loki logs, and Tempo traces simultaneously. These agents run parallel "investigation branches," testing hypotheses with confidence scores to pinpoint the exact code commit or configuration change that caused a regression.
Observability for AI Models (LLMOps)
As every application now includes AI features, the "Prom-Graf" stack has expanded to monitor Large Language Models (LLMs). Prometheus now scrapes metrics like "Tokens per Second" and "Model Latency," while Grafana provides specialized dashboards for tracking Vector Database performance and GPU utilization. This ensures that your AI infrastructure is just as reliable as your traditional web services.
Security Observability: The Rise of "DevSecOps" Monitoring with Prometheus vs Grafana
In 2026, the "Prom-Graf" stack has transcended its origins as a performance tool to become a critical player in the security landscape. By integrating security signals directly into your monitoring workflow, teams can detect, visualize, and mitigate threats in real-time. This shift toward Security Observability allows organizations to break down the silos between DevOps and Security teams.
Audit and Compliance Dashboards
Grafana now offers specialized Security & Compliance templates that track access patterns, configuration changes, and administrative actions across your entire cloud-native fleet.
- Regulatory Tracking: These dashboards help organizations maintain "Continuous Compliance" with global regulations (like GDPR, HIPAA, or the latest 2026 AI ethics standards) by automatically flagging unauthorized permission escalations or unencrypted data transfers.
- Secret Scanning Integration: Modern Grafana plugins can now visualize the results of secret scanning tools, highlighting if a developer accidentally pushed sensitive API keys into a production environment.
Anomalous Pattern Detection & Risk Heatmaps
Prometheus 3.0 leverages Native Histograms and high-cardinality data to spot subtle security anomalies that traditional monitoring might miss.
- Heatmaps of Risk: When linked to Grafana, these metrics are visualized as dynamic heatmaps. For example, a sudden "red zone" on a geographical heatmap might indicate a localized DDoS attack or a coordinated brute-force attempt from a specific IP range.
- Unauthorized API Analysis: By monitoring metadata like user_agent and request_path, Prometheus can identify patterns of "directory traversal" or "credential stuffing" attacks. These are instantly surfaced in Grafana with high-contrast alerts that direct security responders to the specific microservice under fire.
Automated Threat Mitigation (The "Self-Defending" Stack)
The integration doesn't stop at visualization. In 2026, many organizations use Prometheus alerting rules to trigger immediate security remediation.
- Automatic Rate Limiting: If Prometheus detects a threshold-breaking spike in 401 (Unauthorized) errors, it can trigger a webhook to your API Gateway to temporarily rate-limit or block the offending traffic sources.
- Forensic Evidence Capture: When a critical security alert fires, Grafana can automatically generate a "snapshot" dashboard. This captures the state of all logs, traces, and system metrics at the exact millisecond of the breach, providing digital forensics teams with an immutable record of the incident.
Identity and Access Monitoring
With the rise of Zero Trust Architecture, monitoring who is doing what is as important as monitoring system health.
- LBAC (Label-Based Access Control): Grafana and Prometheus now support granular access controls. You can ensure that your developers see performance data while your security analysts see a "Security-Hardened" view that includes sensitive network and identity telemetry.
- Vulnerability Trends: Integration with tools like Trivy or Snyk allows you to track the "Vulnerability Debt" of your container images over time directly in your Grafana Mission Control.
Conclusion
In the rapidly evolving landscape of 2026, the Prometheus vs Grafana debate has shifted from choosing one tool to mastering their integration. As we have explored, Prometheus serves as the high-performance engine for data collection and precise alerting, while Grafana acts as the sophisticated lens through which teams interpret complex telemetry, security risks, and AI performance. Together, they form an indispensable stack for any organization aiming for a zero-downtime, self-healing infrastructure.
However, implementing a modern observability stack that leverages AIOps and DevSecOps requires specialized expertise. To bridge the gap between raw data and actionable business intelligence, many leading firms choose to Hire DevOps Engineers who understand the nuances of high-cardinality data and automated remediation. By bringing in dedicated experts, you ensure your monitoring strategy is not just a defensive measure but a driver of efficiency and innovation.
If you are ready to transform your infrastructure into a proactive, intelligent ecosystem, our team is standing by to assist with your specific implementation needs. Reach out to our technical experts and Contact Zignut today to start architecting a monitoring solution that scales with your ambition. We look forward to helping you achieve total visibility across your digital estate.

Margi Dadhania
DevOps Enthusiast - Focused on building reliable, scalable systems and streamlining deployment processes to deliver smooth and efficient application performance.