
Objective
ELK Stack, is a dynamic trio of open-source tools designed for unparalleled log management and data analytics. ELK, an acronym for Elasticsearch, Logstash, and Kibana, comprises three essential components, each playing a pivotal role in seamlessly collecting , processing , and visualizing data.
Looking for DevOps Engineers?
Enhance your solutions' internal visibility by having effecting logging mechanisms. Talk to our DevOps Engineers now.
Let's TalkElasticsearch:
Role : A distributed search and analytics engine.
Functionality : Elasticsearch excels in storing and indexing data, offering swift searches, advanced analytics, and comprehensive visualization capabilities. Its robust features support full-text search, structured queries, and real-time analytics.
Logstash:
Role : A versatile data processing pipeline.
Functionality : Logstash takes centerstage in collecting, processing, and transferring data from diverse sources to Elasticsearch. Its prowess lies in handling various input formats, applying filters for parsing and enriching data, and seamlessly transporting it to Elasticsearch for indexing.
Kibana:
Role : An intuitive data visualization and exploration tool.
Functionality : Kibana provides a user-friendly web interface to interact with data stored in Elasticsearch. Users can effortlessly create dashboards, employ charts and graphs for data visualization, and explore indexed data. Kibana is the go-to solution for monitoring, troubleshooting, and analyzing log data.
This powerful synergy of Elasticsearch, Logstash, and Kibana forms an indispensable stack for organizations seeking superior log management, real-time analytics, and visualization. Widely embraced across industries such as IT operations, security, and business intelligence, the ELK Stack empowers users to derive valuable insights from vast datasets generated by systems, applications, and devices. Furthermore, its inherent flexibility allows for seamless customization and expansion by integrating additional plugins and components tailored to specific needs . Elevate your data analytics game with the ELK Stack!
Let’s Get Started
Before embarking on the installation journey, ensure you have the following prerequisites in place:
- Ubuntu 22.04Server Setup :
Have an Ubuntu 22.04 server at your disposal equipped with a robust configuration , boasting 4GB RAM and a dual-core processor. Ensure it's configured with anon-root sudo user for enhanced security. - OpenJDK 11Installation :
Make sure OpenJDK 11 is installed on your Ubuntu server. If you haven't done this yet, refer to the comprehensive guide on installing OpenJDK 11 on Ubuntu for step-by-step instructions. This ensures that your server is equipped with the Java Development Kit necessary for the upcoming tasks. - Nginx Configuration :
Nginx, the high-performance web server, is a crucial component. Ensure it's installed and configured on your server. Nginx will serve as the gateway, enhancing the performance and security of your applications.
Step 1 — Elasticsearch Installation and Configuration
When installing Elasticsearch on Ubuntu ,note that its components aren't in the default repositories. To set it up securely, import the Elasticsearch GPG key using cURL, ensuring package authenticity. Use the Elastic package source list to install Elasticsearch via APT, bolstering your system's security.
The Elastic source list should then be added to the sources.list.d directory, which is where APT will look for new sources:
Next, make sure APT can read the updated Elastic source by updating your package lists:
Now, let’s install Elasticsearch with this command:
With Elasticsearch successfully installed, the next step is configuration. Utilize your preferred text editor, like nano, to edit the main configuration file, elasticsearch.yml:
By default, Elasticsearch listens on localhost and port 9200. Modify settings such as network.host and http.port if needed.
Initiate the Elasticsearch service using systemctl and allow a brief startup period to avoid connection errors:
With Elasticsearch operational, proceed to install Kibana, the subsequent component in the Elastic Stack.
Step 2 — Kibana Dashboard installation and configuration
As per official guidelines, installing Kibana after Elasticsearch is essential to ensure the proper setup of dependencies. Following this sequential installation guarantees that each component relies on the correct foundations.
With the Elastic package source already integrated in the prior step, effortlessly install the remaining Elastic Stack components using apt:
Activate and initiate the Kibana services wiftly:
To enable external access to Kibana, configured to listen on localhost, a reverse proxy using Nginx is essential. Follow these steps, assuming Nginx is already installed on your server.
Firstly, create an administrative Kibana user for secure web interface access. Use the openssl command to generate a username and password, storing them in the htpasswd.users file. Opt for anon-standard, secure username for enhanced security.
Command:
This creates the administrative user and password, paving the way for Nginx configuration. The next steps involve configuring Nginx to require this username and password for secure access.
Enter and confirm a password at the prompt; remember it for accessing the Kibana web interface later.
Moving forward, create an Nginx server block file. As an example, we'll refer to it as "your_domain," but feel free to choose a more descriptive name. If you have an FQDN and DNS records set up, consider naming the file after your FQDN.
Use your preferred text editor, like nano, to craft the Nginx server block file:
Insert the following code block into the file, making sure to update "your_domain" to match your server’s FQDN or public IP address. This code directs Nginx to route your server’s HTTP traffic to the Kibana application on localhost:5601. Additionally, it configures Nginx to read the htpasswd.users file, enforcing basic authentication.
If you've completed the Nginx tutorial previously, you may already have this file. In that case, clear any existing content before adding the following:
When you’re finished, save and close the file.
This configuration enhances Nginx to securely manage access to the Kibana application.
To activate the new configuration, create a symbolic link to the sites-enabled directory. Skip this step if you've already created a server block file with the same name during the Nginx prerequisite:
Then check the configuration for syntax errors:
If any errors surface in the output, revisit your configuration file to ensure accurate content placement. Once you verify that the syntax is correct, proceed to restart the Nginx service:
If you're using UFW firewall, adjust rules to permit connections to Nginx:
With this adjustment, Kibana becomes accessible via your FQDN or public IP address. Check the Kibana server's status page at:
http://your_domain/status
Log in with your credentials when prompted. Now that the Kibana dashboard is set up, proceed to install the next component: Logstash.
Step 3 — Installing and Configuring Logstash
While Beats can send data directly to Elasticsearch, leveraging Logstash is a common practice for added flexibility. Logstash provides the versatility to collect data from diverse sources , transform it into a unified format, and then export it to another database. This approach enhances your ability to manage and process data efficiently within the Elastic Stack.
Install Logstash with this command:
Post Logstash installation, proceed with configuration in the /etc/logstash/conf.d directory. For a comprehensive understanding of the configuration syntax, refer to Elastic's provided configuration reference.
View Logstash as a pipeline – it takes in data, processes it, and directs it to its destination, typically Elasticsearch. A Logstash pipeline comprises two essential elements, input and output, with the optional inclusion of filter. Input plugins gather data, filter plugins process it, and output plugins route it to the destination.
Create a file named"02-beats-input.conf" to configure your Filebeat input:
Insert the following input configuration.
This specifies a beats input that will listen on TCP port 5044.
Save and close the file.
Next, create a configuration file called 30-elasticsearch-output.conf :
Insert the following output configuration to guide Logstash in storing Beats data in Elasticsearch.
This configuration designates Elasticsearch at localhost:9200, using an index named after the specific Beat utilized. In this tutorial, the Beat in focus is Filebeat:
Save and close the file.
Test your Logstash configuration with this command:
To validate your Logstash configuration, execute a syntax check.
A successful configuration test will display "Config Validation Result: OK. Exiting Logstash after a few seconds." If not, review your output for errors and rectify your configuration accordingly. Ignore warnings from OpenJDK; they are generally benign.
Assuming your configuration test succeeds, commence Logstash:
With Logstash operational and configured, proceed to install Filebeat for the next phase of the setup.
Step 4 — Installing and Configuring Filebeat
The Elastic Stack employs light weight data shippers called Beats to gather and transport data from diverse sources to Logstash or Elasticsearch. Here are some available Beats:
Filebeat : Collects and ships log files.
Metricbeat : Gathers metrics from systems and services.
Packetbeat : Collects and analyzes network data.
Winlogbeat : Captures Windows event logs.
Auditbeat : Gathers Linux audit frame work data and monitors file integrity.
Heartbeat : Monitors service availability through active probing.
For this tutorial, we'll utilize Filebeat to forward local logs to the Elastic Stack. Install Filebeat via apt:
Next, configure Filebeat to connect to Logstash. Here, we will modify the example configuration file that comes with Filebeat.
Open the Filebeat configuration file:
While Filebeat supports various outputs, the common practice is to send events either directly to Elasticsearch or to Logstash for additional processing. In this tutorial, Logstash will handle additional data processing. Disable the direct output to Elasticsearch by commenting out the following lines within the output.
elastic search section:
...
#output.elasticsearch:
#Array of hosts to connect to.
#hosts: ["localhost:9200"]
...
This adjustment ensures that Filebeat exclusively forwards data to Logstash for enhanced processing within the Elastic Stack.
Proceed to configure the output. logstash section in Filebeat. Uncomment the lines output. logstash: and hosts:["localhost:5044"] by removing the #. This configuration instructs Filebeat to establish a connection with Logstash on your Elastic Stack server ,specifically at port 5044 – the port designated for Logstash input as specified earlier:
output.logstash:
#The Logstash hosts
hosts: ["localhost:5044"]
Save and close the file.
This ensures seamless communication between Filebeat and Logstash for efficient data transfer within the Elastic Stack.
Filebeat's capabilities can be enhanced through modules, and for this tutorial, we'll leverage the system module. This module adeptly gathers and parses logs generated by the system logging service on common Linux distributions.
Enable the system module with:
To view enabled and disabled modules, execute:
Filebeat, by default, employs standard paths for syslog and authorization logs. For this tutorial, no configuration adjustments are required. Explore the module parameters in the /etc/filebeat/modules.d/system.yml configuration file.
Next, establish the Filebeat ingest pipelines that preprocess log data before transmission to Logstash and Elasticsearch. Load the ingest pipeline for the system module:
This step ensures seamless integration and optimal processing of system logs within the Elastic Stack.
Now, load the index template into Elasticsearch to facilitate organized document collections. Index templates are automatically applied when creating a new index. Execute the following command:
Filebeat includes pre-packaged Kibana dashboards for visualizing data. Before utilizing these dashboards, create the index pattern and load dashboards into Kibana. During dashboard loading , Filebeat checks Elasticsearch version information. To load dashboards with Logstash enabled, disable the Logstash output and enable Elasticsearch output:
This ensures seamless integration of Filebeat data into Elasticsearch for visualization in Kibana.
Now you can start and enable Filebeat:
If your Elastic Stack setup is configured correctly, Filebeat will initiate the shipping of syslog and authorization logs to Logstash, which, in turn, loads the data into Elasticsearch.
To confirm that Elasticsearch is successfully receiving this data, execute the following command to query the Filebeat index:
Inspect the output of the command. If it displays 0 total hits, Elasticsearch isn't loading any logs under the specified index. In this case, review your setup for potential errors. If you see the expected output, proceed to the next step, where we'll explore navigating through some of Kibana’s dashboards.
Step 5 — Exploring Kibana Dashboards
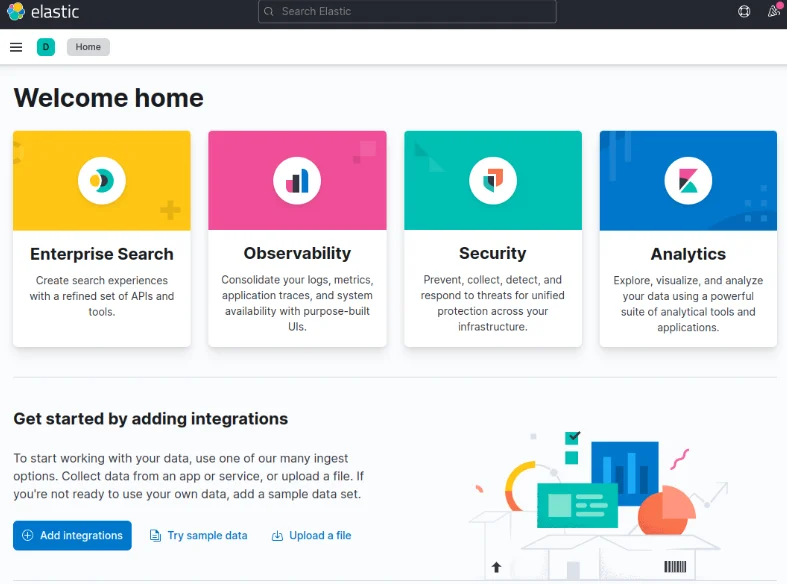
Revisit the Kibana web interface installed earlier by navigating to the FQDN or public IP address of your Elastic Stack server in a web browser. If your session was interrupted , re-enter the credentials defined in Step 2. Upon successful login, you'll land on the Kibana homepage:
http://your_domain
Explore the capabilities of Kibana for visualizing and analyzing the logs collected by Filebeat.
Navigate to the "Discover" linkin the left-hand navigation bar of Kibana (expand the menu if needed). On the Discoverpage, choose the predefined "filebeat-*" index pattern to visualizeFilebeat data. The default display will present all log data from the last 15minutes, featuring a histogram of log events and corresponding log messagesbelow.
Explore the Discover page to gain insights into your log data using Kibana's user-friendly interface.
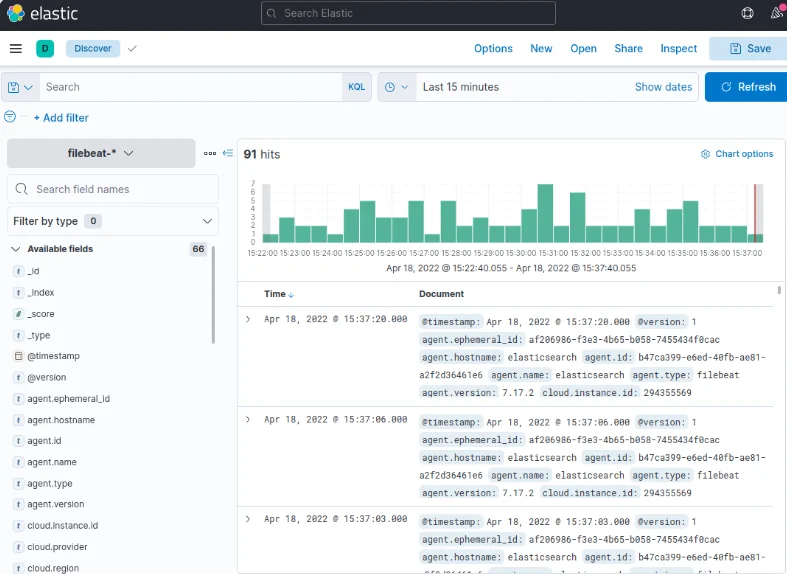
Explore the "Discover" page in Kibana to search, browse, and customize your logs. At this juncture, the content might be limited as you're solely collecting syslogs from your Elastic Stack server.
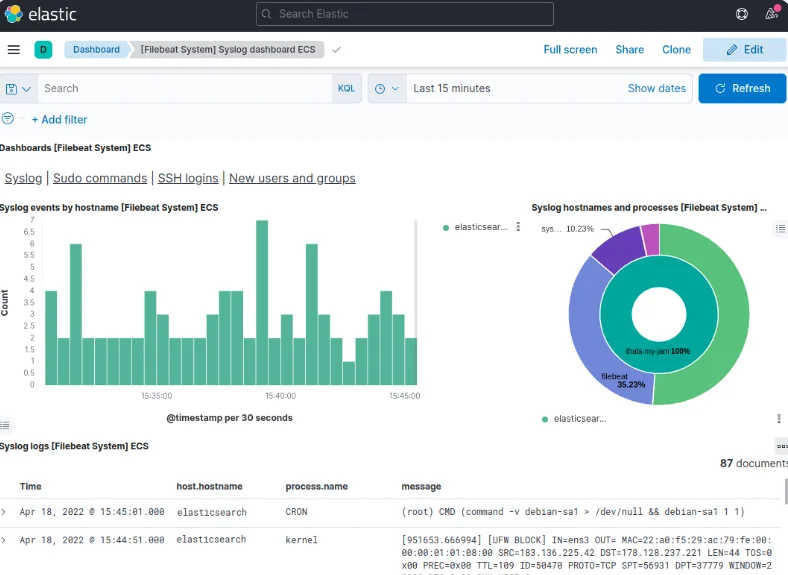
Head to the Dashboard page via the left-hand panel and search for the "Filebeat System" dashboards. Select the sample dashboards accompanying Filebeat’s system module. These dashboards offer detailed statistics derived from syslog messages, providing valuable insights into your log data.
Leverage Kibana's intuitive interface to delve into your logs and extract meaningful information.
Conclusion
In this tutorial, you've mastered the installation and configuration of the Elastic Stack to efficiently collect and analyze system logs. While Beats can transmit various log or indexed data to Logstash, the real power lies in parsing and structuring the data with Logstash filters. This transformation ensures a consistent format, enhancing readability and maximizing the utility of your data within Elasticsearch.
Explore the vast capabilities of the Elastic Stack to streamline your log management and gain valuable insights into your system's performance.

Zignuts Technolab
Zignuts Technolab delivers future-ready tech solutions and keeps you updated with the latest innovations through our blogs. Read, learn, and share!